 EN
EN  čeština
  Polski
  Slovenčina
  Русский
  Deutsch
  Slovenski
  Dutch
Dutch  Svenska
  Português
  Italiano
  Español
  Français
  Suomalainen
  Български
  Românesc
  Magyar
  Eesti
Eesti  Ελληνική
  Latviešu
  Lietuvių
  やまと
やまと  中国
中国  Dansk
Dansk  Türkçe
  ID
ID  Українська
  한국어
한국어  Norsk
Norsk  Peter Sommer
 What do the Statistics say?
On the following table you can see the system from the viewpoint of the probability and the expected profit:
| Spin | Probability | Profit in Series | Expected Profit |
| 1 | 13.51% | 31 | 4,1892 |
| 2 | 11.69% | 26 | 3.0387 |
| 3 | 10.11% | 21 | 2.1227 |
| 4 | 8.74% | 16 | 1.3987 |
| 5 | 7.56% | 11 | 0.8317 |
| 6 | 6.54% | 6 | 0.3923 |
| 7 | 5.66% | 1 | 0.0566 |
| 8 | 4.89% | 151 | 7.3856 |
| 9 | 4.23% | 121 | 5.1185 |
| 10 | 3.66% | 91 | 3.3292 |
| 11 | 3.16% | 61 | 1.9301 |
| 12 | 2.74% | 31 | 0.8483 |
| 13 | 2.37% | 156 | 3.6921 |
| 14 | 2.05% | 101 | 2.0674 |
| 15 | 1.77% | 46 | 0.8143 |
| 16 | 1.53% | 146 | 2.2353 |
| 17 | 1.32% | 66 | 0.8739 |
| 18 | 8,47% | -510 | -43.2206 |
| Total | 100% | -2.8956 |
Unfortunately, the expected profit resulted in a loss, therefore in the long term, the system should go below zero. Let’s have a look at the progression of the basic system on the following graph:
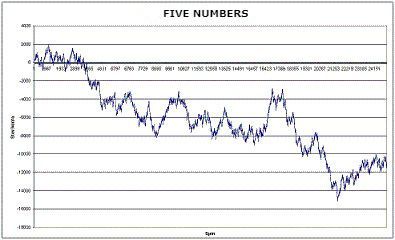
Our expectations became true and in spite of the short-term growth, the system sloped downward, (it had a downward trend). There were several options on how to modify the system but we were not able to apply all of them.
There was no point in altering the series length. It follows (from the table above) that as long as the series was, always the expected profit results in a loss (we had tested a series of 5 spins and a series of 25 spins). At the first sight, you would assume that there is a chance that you hit at least one number within 17 spins, but empirically based research had confirmed that there were also series when the roulette did not hit any number of a certain pentad 50 times in a row.
Applying the wait strategy would not be also supposed to have a success. We have attempted to apply at least a liner series progression; it means that after each unsuccessful series, we increased the roulette bet size on each number by the value of initial bet and after making a profit we reset the bet size back to initial bet:
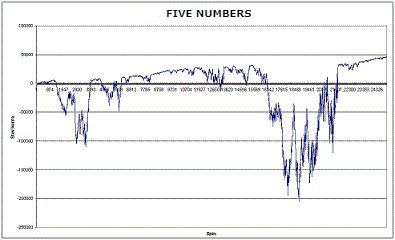
As you could see, the system appeared to go to a plus and had an upward trend but the local slumps were drastically huge and reached values of hundreds of thousands below zero, therefore an idea of series progression was not successful. We have tried to apply some modification by employing a spin progression of the bet in one series in order that a win always reached a minimum value.
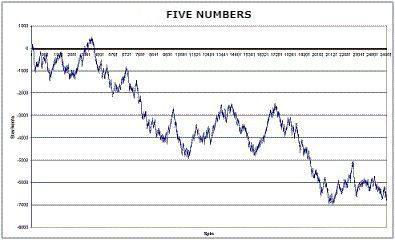
Unfortunately, we did not observe any amelioration and the progression practically remained the same as before. We can conclude that this system in this form is not feasible in the long term.


You have to be logged in to add a comment